
THE BRIEF
Profiling your existing database intelligence gives you a full understanding of a company’s very first customer right up until today. Database Intelligence gives clients that insight in a format that helps you inform your marketing across all channels by cross-matching your customer data with our comprehensive market data algorithm, within a traditional data report medium.
The key aim, to deliver a fluid client experience that offered a multi-data approach using various forms of data to create an accurate picture of the client’s average customer. The system must set boundaries to cross-matching data sets but also deliver a powerful set of tools to encourage exploring and discovery.

We were set the task of taking the already established Data intelligence model and create an interactive system to deliver the client’s customer data in a form that empowered clients.
Delivering all customers business analytics in one convenient app while cross-matching it with data intelligence’s data at their own will.

PROBLEM

Early Dashboard wireframes that became too cluttered and unorganised.
1) The infinite nature of data presented a problem with setting user expectations, in a perfect world you could take multiple sets of data and show them in a large graph for one data point such as product vs time. We realised early on that boundaries were needed to ensure the data displayed was understood and key data was represented clearly with out empty graphs or irrelevant data on show.
Data classification models to keep search boundaries in place
2) Another key challenge was to create an overview dashboard, a place where the clients could customise and obtain a big-picture view of there data and understand how the company was growing in the key areas relevant to the business’s KPI’s.
3) Designing a fluid system that leverages all data variables including Time, Location, Sales amount while cross-referencing DB intelligence’s data with the clients data to deliver key market insights about their customer base.

Dashboard View
SOLUTION

1) A data filter system was implemented to combat the issue of managing the cross-referencing of filtered searches. Up to 5 data profiles could be set at one time within the system viewport showing each profile as its own series within the set graphs.
The key variables for each data profile can be set in the filters menu, offering a high level of analysis while managing the viewable data to create a dynamic user experience drills down into the specific customer data and behaviour you are looking to explore.
Each data profile can be viewed individually or crossmatched allowing exploration of data to take place. This will make understanding business performance effortless while giving the user the freedom to discover hidden wisdom within past sales data.

2) The Customizable window design can be customized uniquely to every individual user using workspaces to leverage data analytics for every role the user assumes. The system will determine what can be shown based on their customer data provided to the onboarding team, meaning empty graphs or empty windows are non-existent. A new window can be added at any time from the customer data available and will show cross-referenced data when more than one data profiles are selected in the filters bar.

Filter Panel: Set filters for each data preset effortlessly.
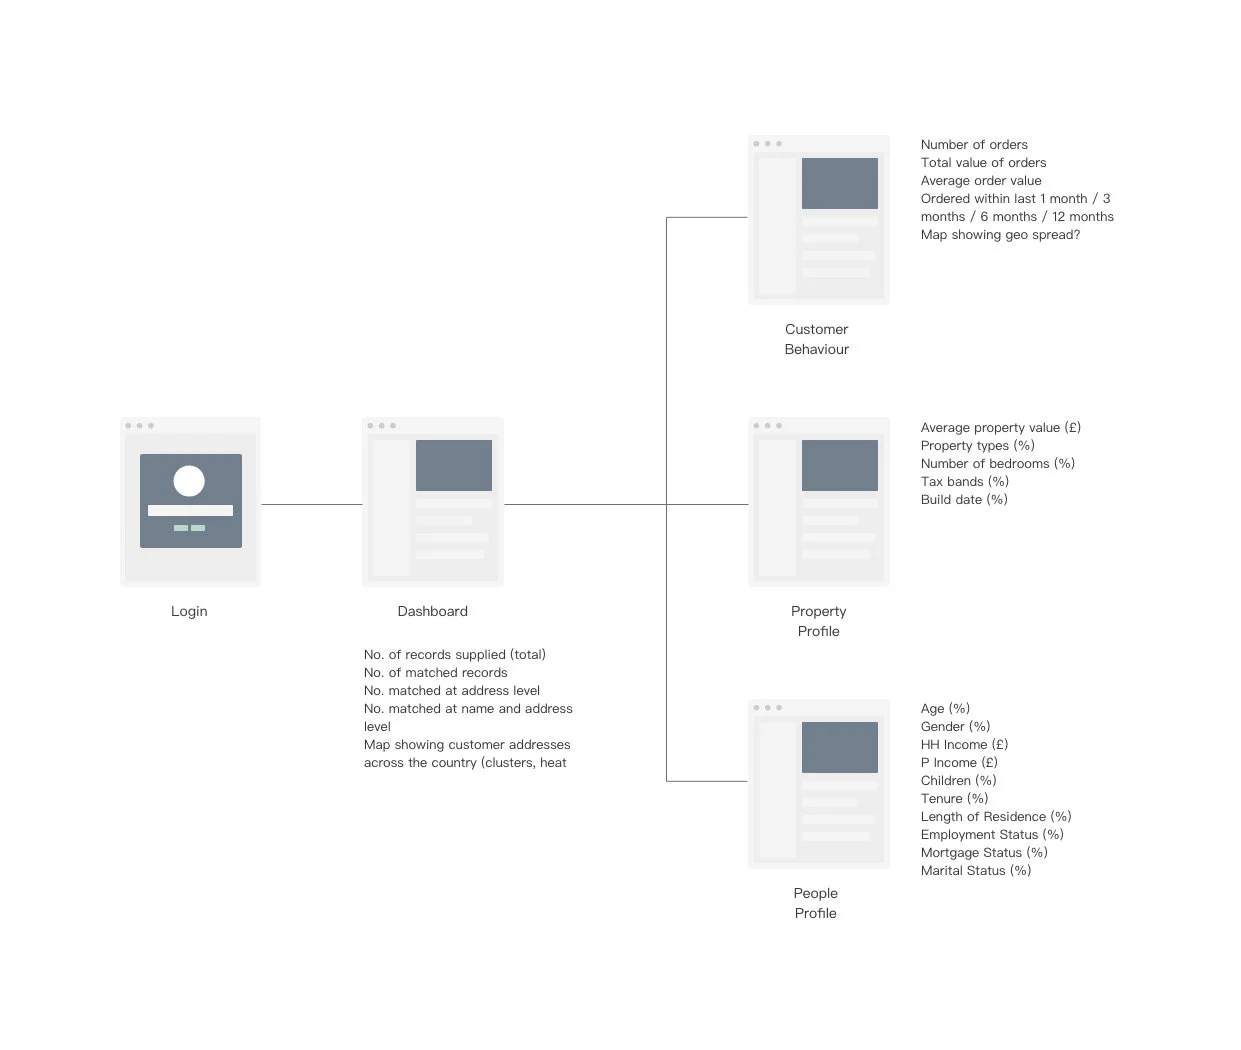
3) We simplified the data views by focusing on three main channels users could view their data, the dashboard, a map view and specific grouped data ( which consisted of people data, property data and customer behaviour).
The map view fused with the power of the filter system gives users the ability to showcase data for presentations levering geographical sales hotspots. Used correctly this can unlock untapped parts of the country where marketing efforts can be deployed.
a fluid graph and map experience was CREATED in presentations and meeting to support your stats.
Giving the user the ability to switch between data sets and search results with speed during meetings to maximise the key findings. The power to see sales, customers, logistical locations ( including depot, advertising, and production locations delivers a key tool for identifying underperforming areas and opportunities for new marketing strategies

